


 5 / 12

>
‘08
‘09
‘10
‘11
‘12
‘13
‘14
‘15
Average Cost of Kilowatt Hours Sold
6.7¢ 7.5¢ 7.7¢ 8.4¢ 8.9¢ 9.3¢ 9.4¢ 9.7¢
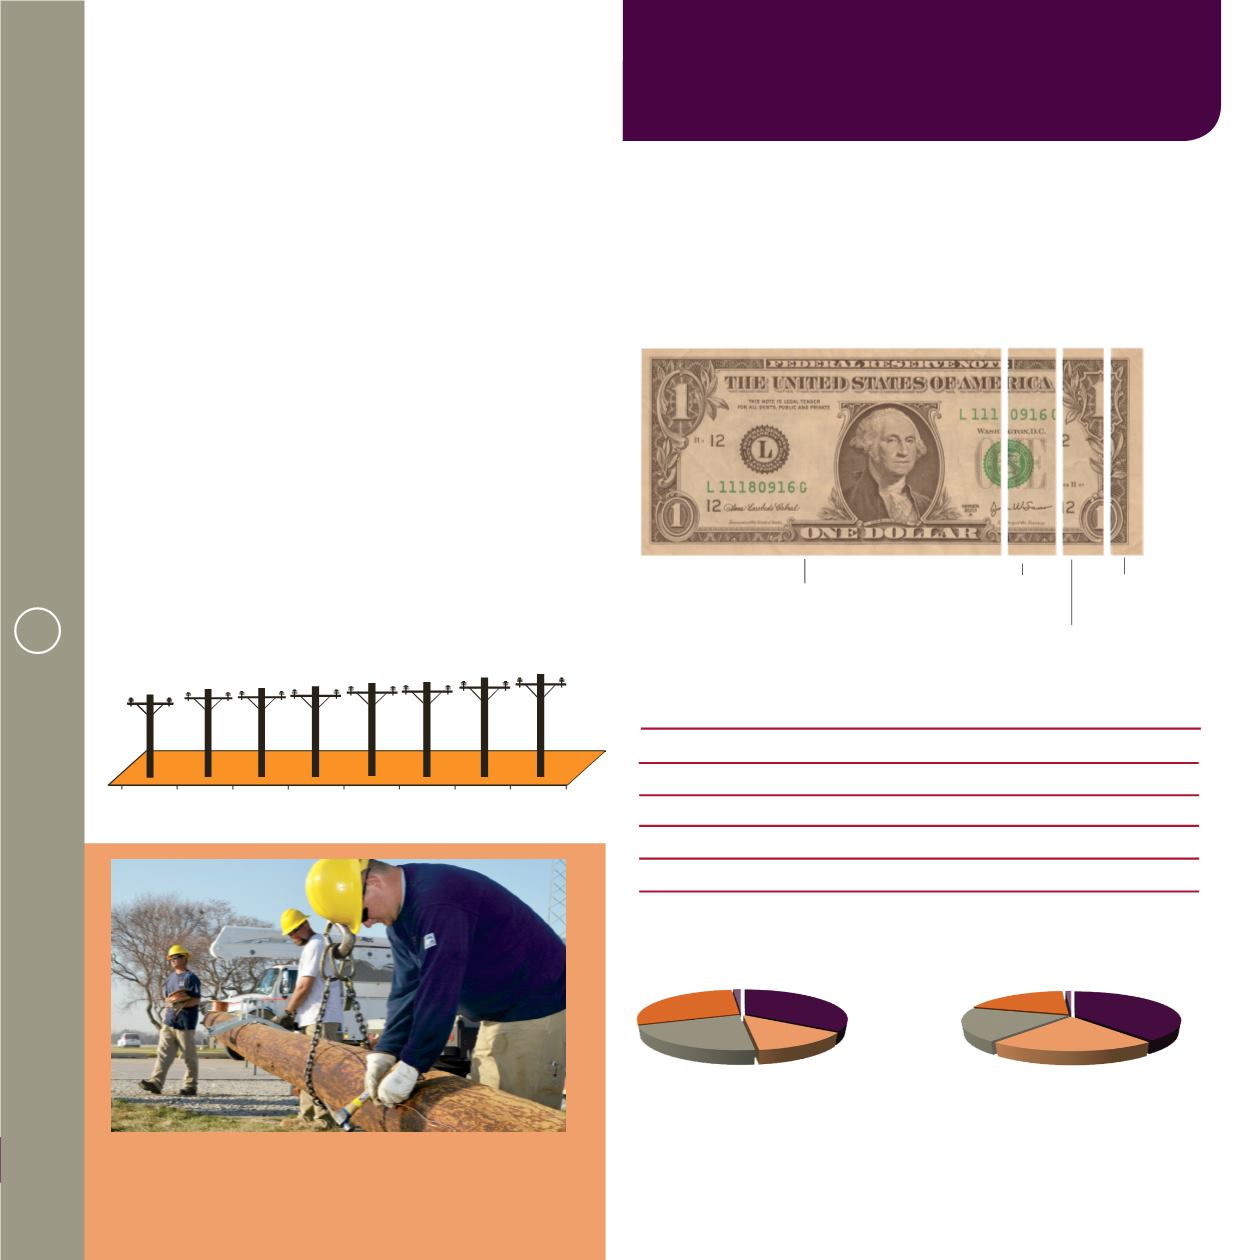
When Cornhusker Public Power District breaks down the av-
erage kWh into its expense components, you can see how the
percentage of each expense contributes to the overall cost. The
largest expense is the cost of power, which was 72.1% of our
total expense for 2015.
operations
A strong mix of commercial, industrial and farming sales supported by a
reliable residential load provides excellent diversity to a solid customer base..
Line Technicians (from left) Jim Baumert, Clint Williams
and Eric Brabec install a three-phase service.
May, 2015
Bond rating at AA-/Stable
Cornhusker Public Power District’s rating from
Standard
and Poor’s
for issuing tax-exempt bonds is AA-/Stable.
Cornhusker Public Power District’s good rating reflects a
solid and reliable financial performance supported by the
following credit strengths:
• Consistently stable financial performance over the past
three years (2012-2015)
• Cost-based purchased-power agreement with Nebraska
G&T acting on behalf of Nebraska Public Power District
provides Cornhusker Public Power District with very
competitively priced purchased power
• A voluntary and highly subscribed-to load management
program shifts the bulk of irrigation load to off-peak
hours in the summer, saving an estimated $2 million
annually in wholesale power costs
Comparison of Revenue to Sales in 2015
Type of Customer
kWh Sales
Revenue
Residential/Seasonal
122,721,934
$13,557,684
Irrigation
48,808,839
$7,431,879
Commercial
76,324,028
$6,521,303
Industrial
104,026,635
$6,674,325
Other
5,617,826
$406,250
Residential/
Seasonal
Irrigation
Commercial
Industrial
Other
2015 kWh Sales
Residential/
Seasonal
Irrigation
Commercial
Industrial
Other
2015 Revenue
How Is My Electricity Dollar Spent?
v r st of ilo att Hours Sold
Cost of Power
72.1%
Depreciation/Interest
10.7%
Operations/Maintenance
9.4%
Admin/Customer
Service 7.7%
•
• •
•